Built an interactive dashboard with 3 years of sales report for sales tracking.
Built an interactive Map dashboard to visualize state wise report.
→
→
→
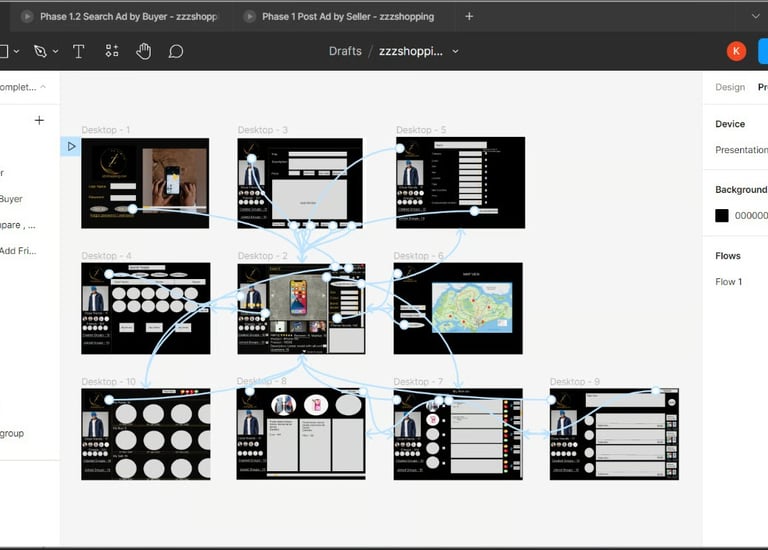
Figma - Website Prototype
Built an interactive Map dashboard to visualize state wise report.
Designed a website using Figma
My work on Digitalisation Projects
A selection of projects showcasing my skills on Data Analytics, Digital Transaformation and Robotic Process Automation.
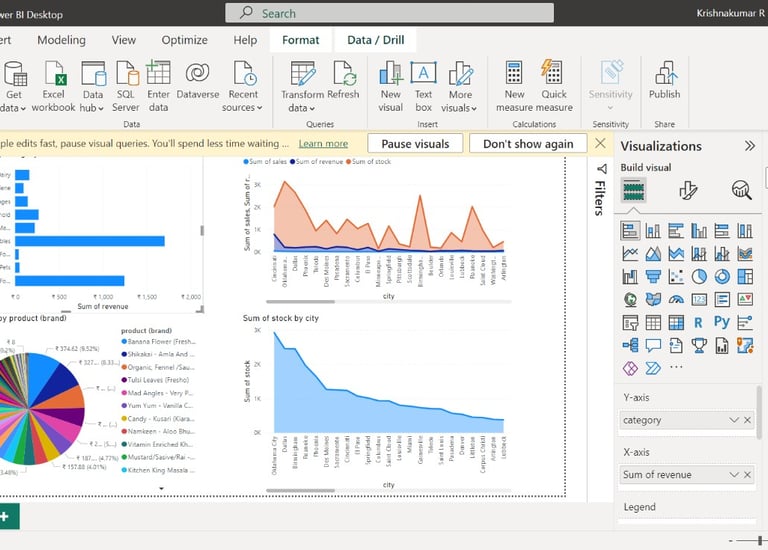
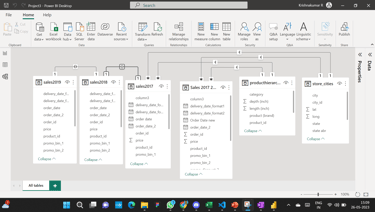
Power BI Dashboard
The Power BI Interactive Dashboard, meticulously crafted using the sales reports of three consecutive years, serves as a pivotal analytical tool for enhancing business decision-making processes.
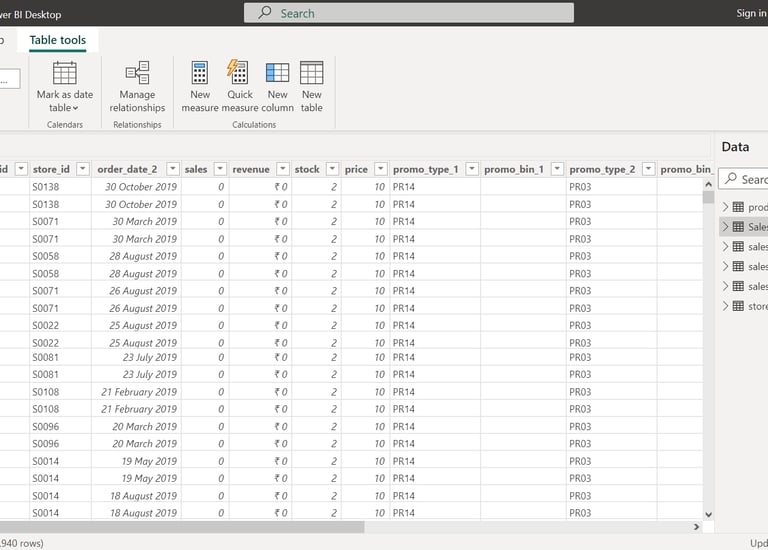
ETL
(Extract, Transform & Loading)
It is a process used in data integration and management to extract data from various sources, transform the data into a suitable format, and then load it into a target destination.
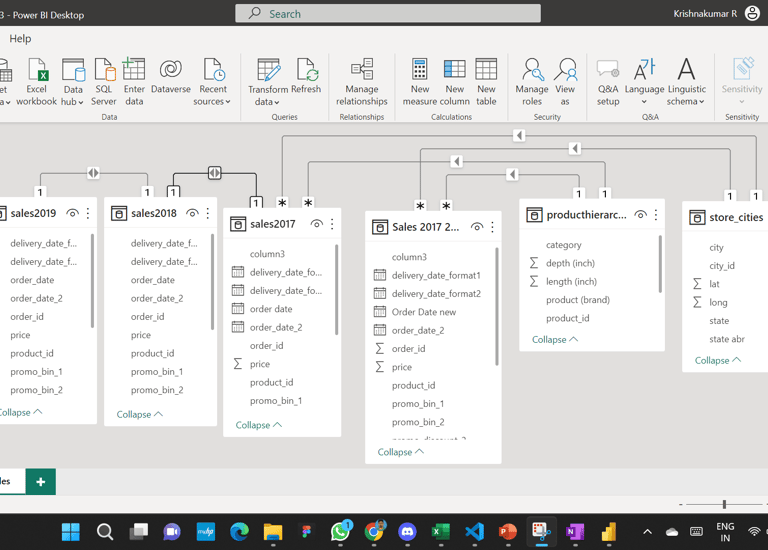
Data Mapping
Data mapping is the process of matching fields from one data source to another, ensuring that the data is accurately transferred and transformed between the two systems which is source system and the target system.
Insights Projection
Insights projection refers to the process of analyzing, understanding, and interpreting data in order to discover valuable insights and patterns that can then be used to make informed decisions.
By integrating data trends and seasonal variations over this substantial period, the dashboard offers comprehensive insights into sales performances, helping to identify patterns and anomalies. Advanced features within Power BI allow for dynamic filtering and real-time visualization of datasets, enabling stakeholders to drill down into specific metrics such as regional sales differences or product line successes with ease. Furthermore, predictive analytics and trend forecasting capabilities provide proactive opportunities for strategizing future market approaches. This layered approach not only facilitates more informed decisions but also provides actionable intelligence tailored to various departmental needs—from marketing strategies to supply chain adjustments—ensuring a synchronized corporate strategy focused on fostering sustained growth and competitive advantage in the marketplace.
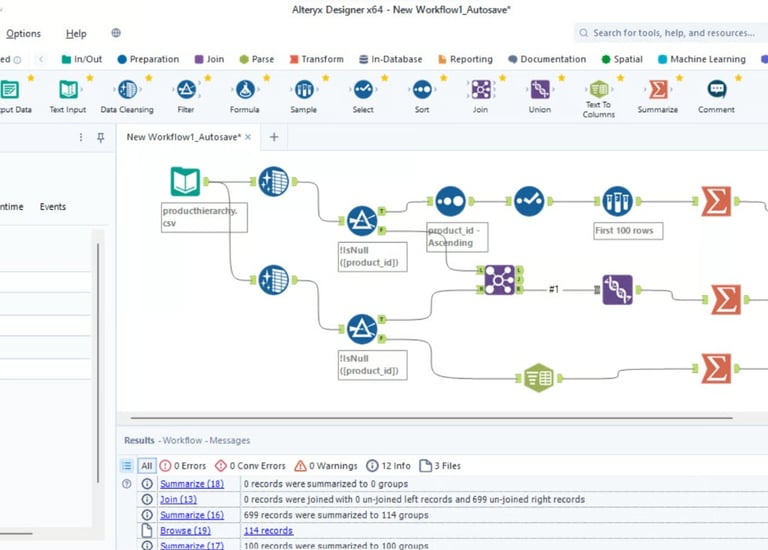
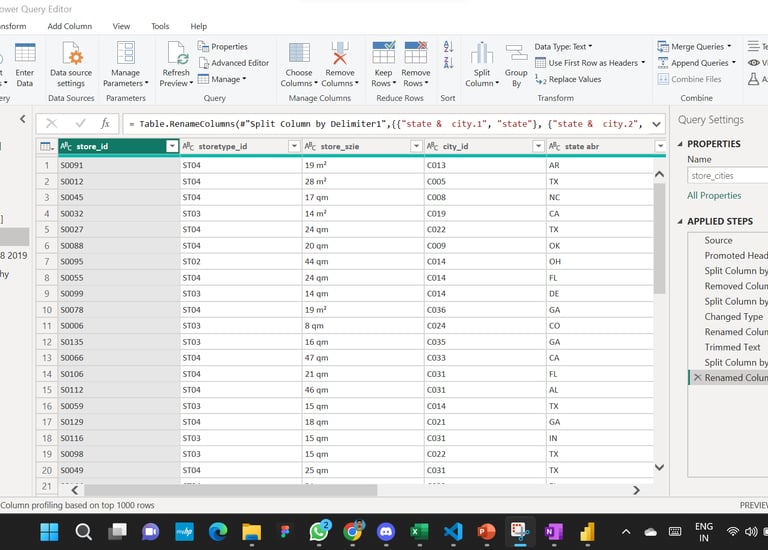
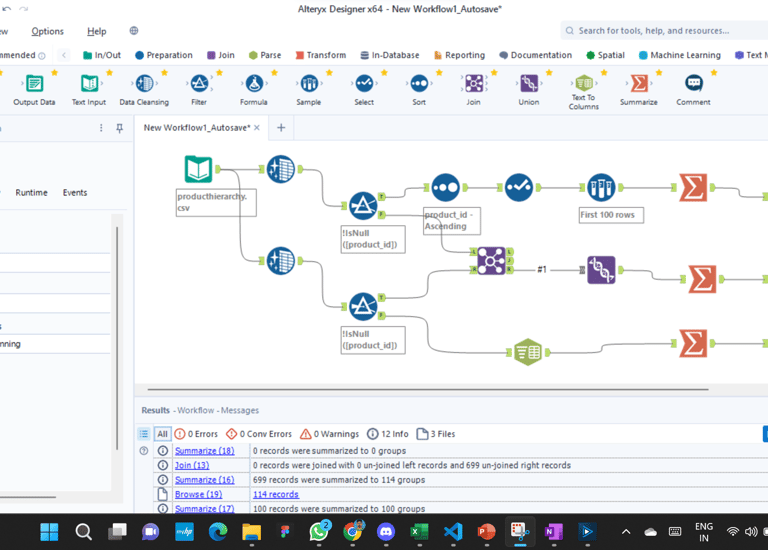
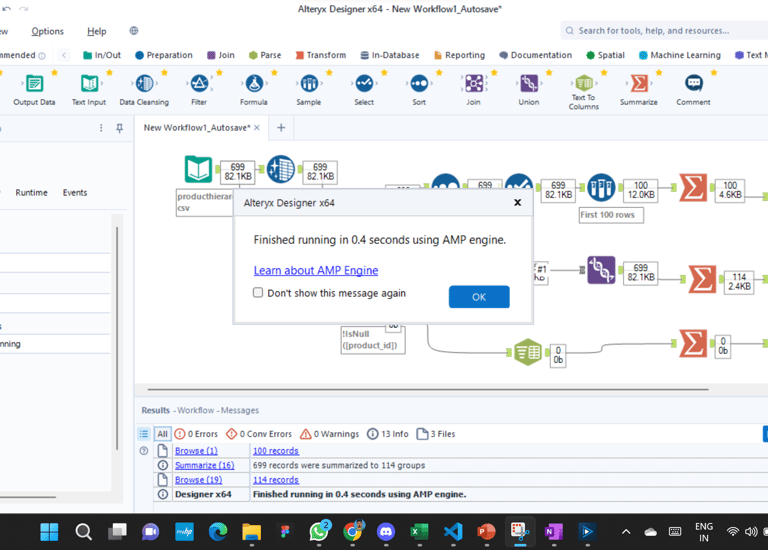
Alteryx Project
In the realm of data analytics, Alteryx stands out as a powerful tool for processing big data through its intuitive workflow-based interface. By utilizing a drag-and-drop framework, Alteryx allows users to construct complex data processes visually, thereby circumventing the need for intricate coding. The workflow design leverages an array of tools that perform tasks such as data preparation, blending, and advanced analytics with efficiency and precision. This modular approach not only facilitates seamless integration of diverse datasets but also enables rapid iteration and prototyping. The scalability of Alteryx workflows ensures they can handle large volumes of data while maintaining performance integrity. As users develop these workflows in Alteryx Designer, they benefit from real-time feedback on operations, allowing for immediate adjustments that optimize outcomes. Furthermore, the platform's robust community support enriches user knowledge and fosters collaborative problem-solving in an ever-evolving data landscape.
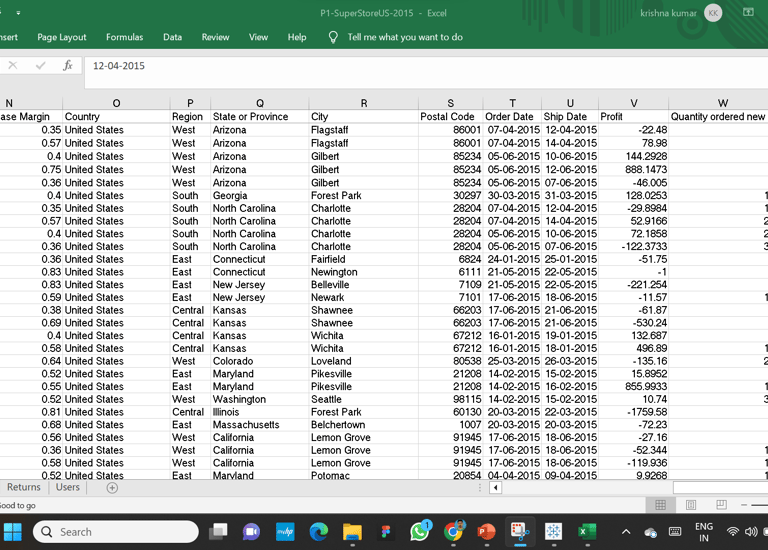
Explore the the source system data
Automated Queries Update
The big source system data is organized and split with queries and for the processing the requirement without disturbing the source data raw file
The automated queries will process and produce the output in the storage location
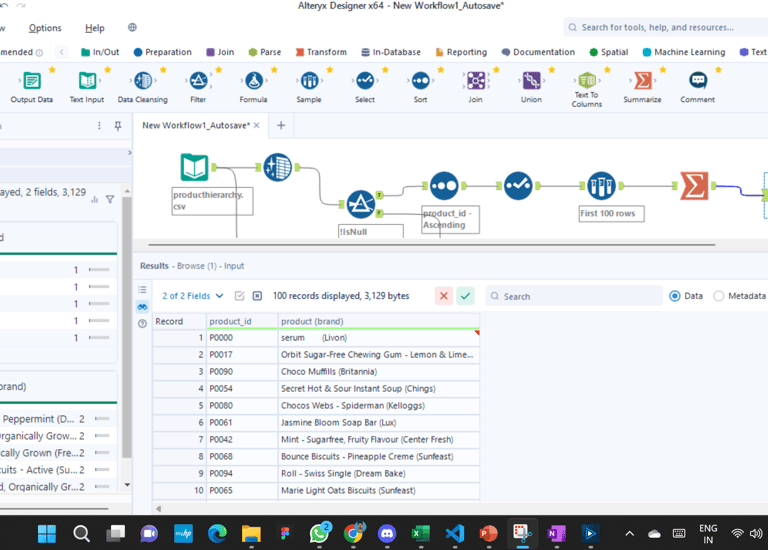
Output Data Analysis
The output data can be visualized and can be routed to other system for processing data visualizations
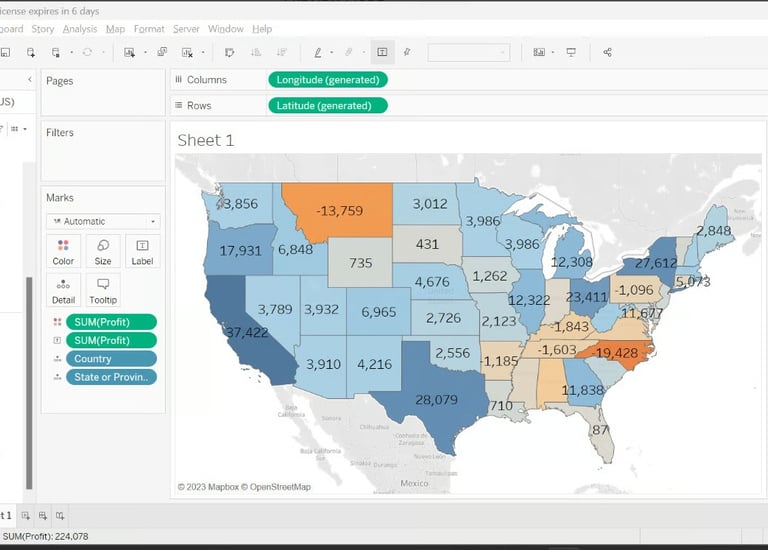
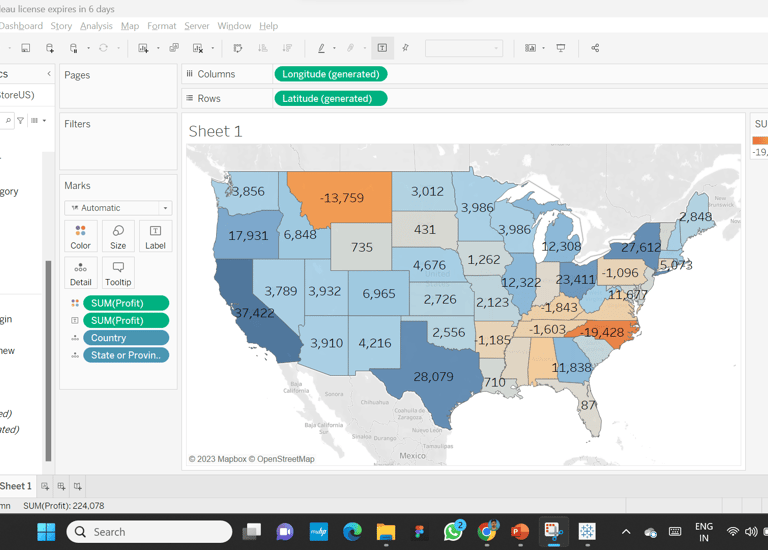
Tableau Dashboard
We created an interactive dashboard using Tableau to show sales and profit margins for each state in the USA. This dashboard makes it easy to analyze important data and see how each state is performing. Users can explore different states and compare their sales figures and profit margins. With clear visuals and easy-to-understand charts, the dashboard helps businesses make informed decisions and find areas for improvement. Overall, it’s a useful tool for anyone looking to understand sales performance across the country.
Data Gathering
Data Gathering from various source systems
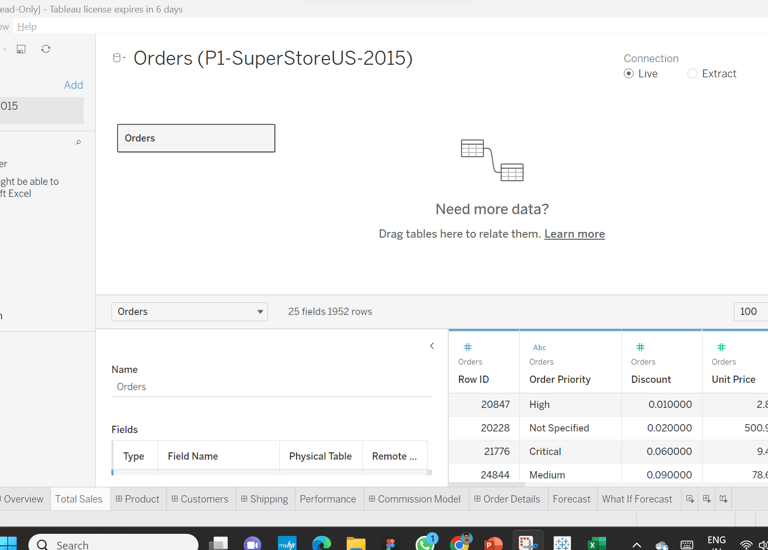
Data Mapping
Mapping the different source data with common key factors
Insights Projection
Insights projection refers to the process of analyzing, understanding, and interpreting data in order to discover valuable insights and patterns that can then be used to make informed decisions.
Data Projection
Data projection in Tableau is a way to show information in a visual format, making it easier to understand
Contact
Phone
krishhh1991@gmail.com
+61-455435496
© 2025. All rights reserved.
LOCATION
East Perth, WA-6004